
Reports & insights
Know your day, week, and menu cold.
- X-report or Z-report – the difference matters
- The money, at the top
- Reading the shape of the day
- Labour and tips
- The accountability section
- Reconciling the drawer
- Margin, when you've costed the menu
- All orders – the day's receipts
- Insights – the deeper reporting
- Menu engineering – the four quadrants
- Food cost & recipes
- Profit & loss
- Which report answers which question
X-report or Z-report – the difference matters
Sales Overview is one page that runs in two modes, and picking the wrong one is the most common reporting mistake.
Z-Report (day) covers a whole business day. It's the end-of-night record – the one you file, compare against the drawer, and reach for weeks later when a number looks wrong.
X-Report (current shift) covers only the currently open drawer session. It's the mid-shift read: how are we doing right now, what should be in the till at this moment. If no drawer is open it quietly falls back to showing today.
Both accept a From / To date range, so the same page also does last week, last month, or a single Saturday.
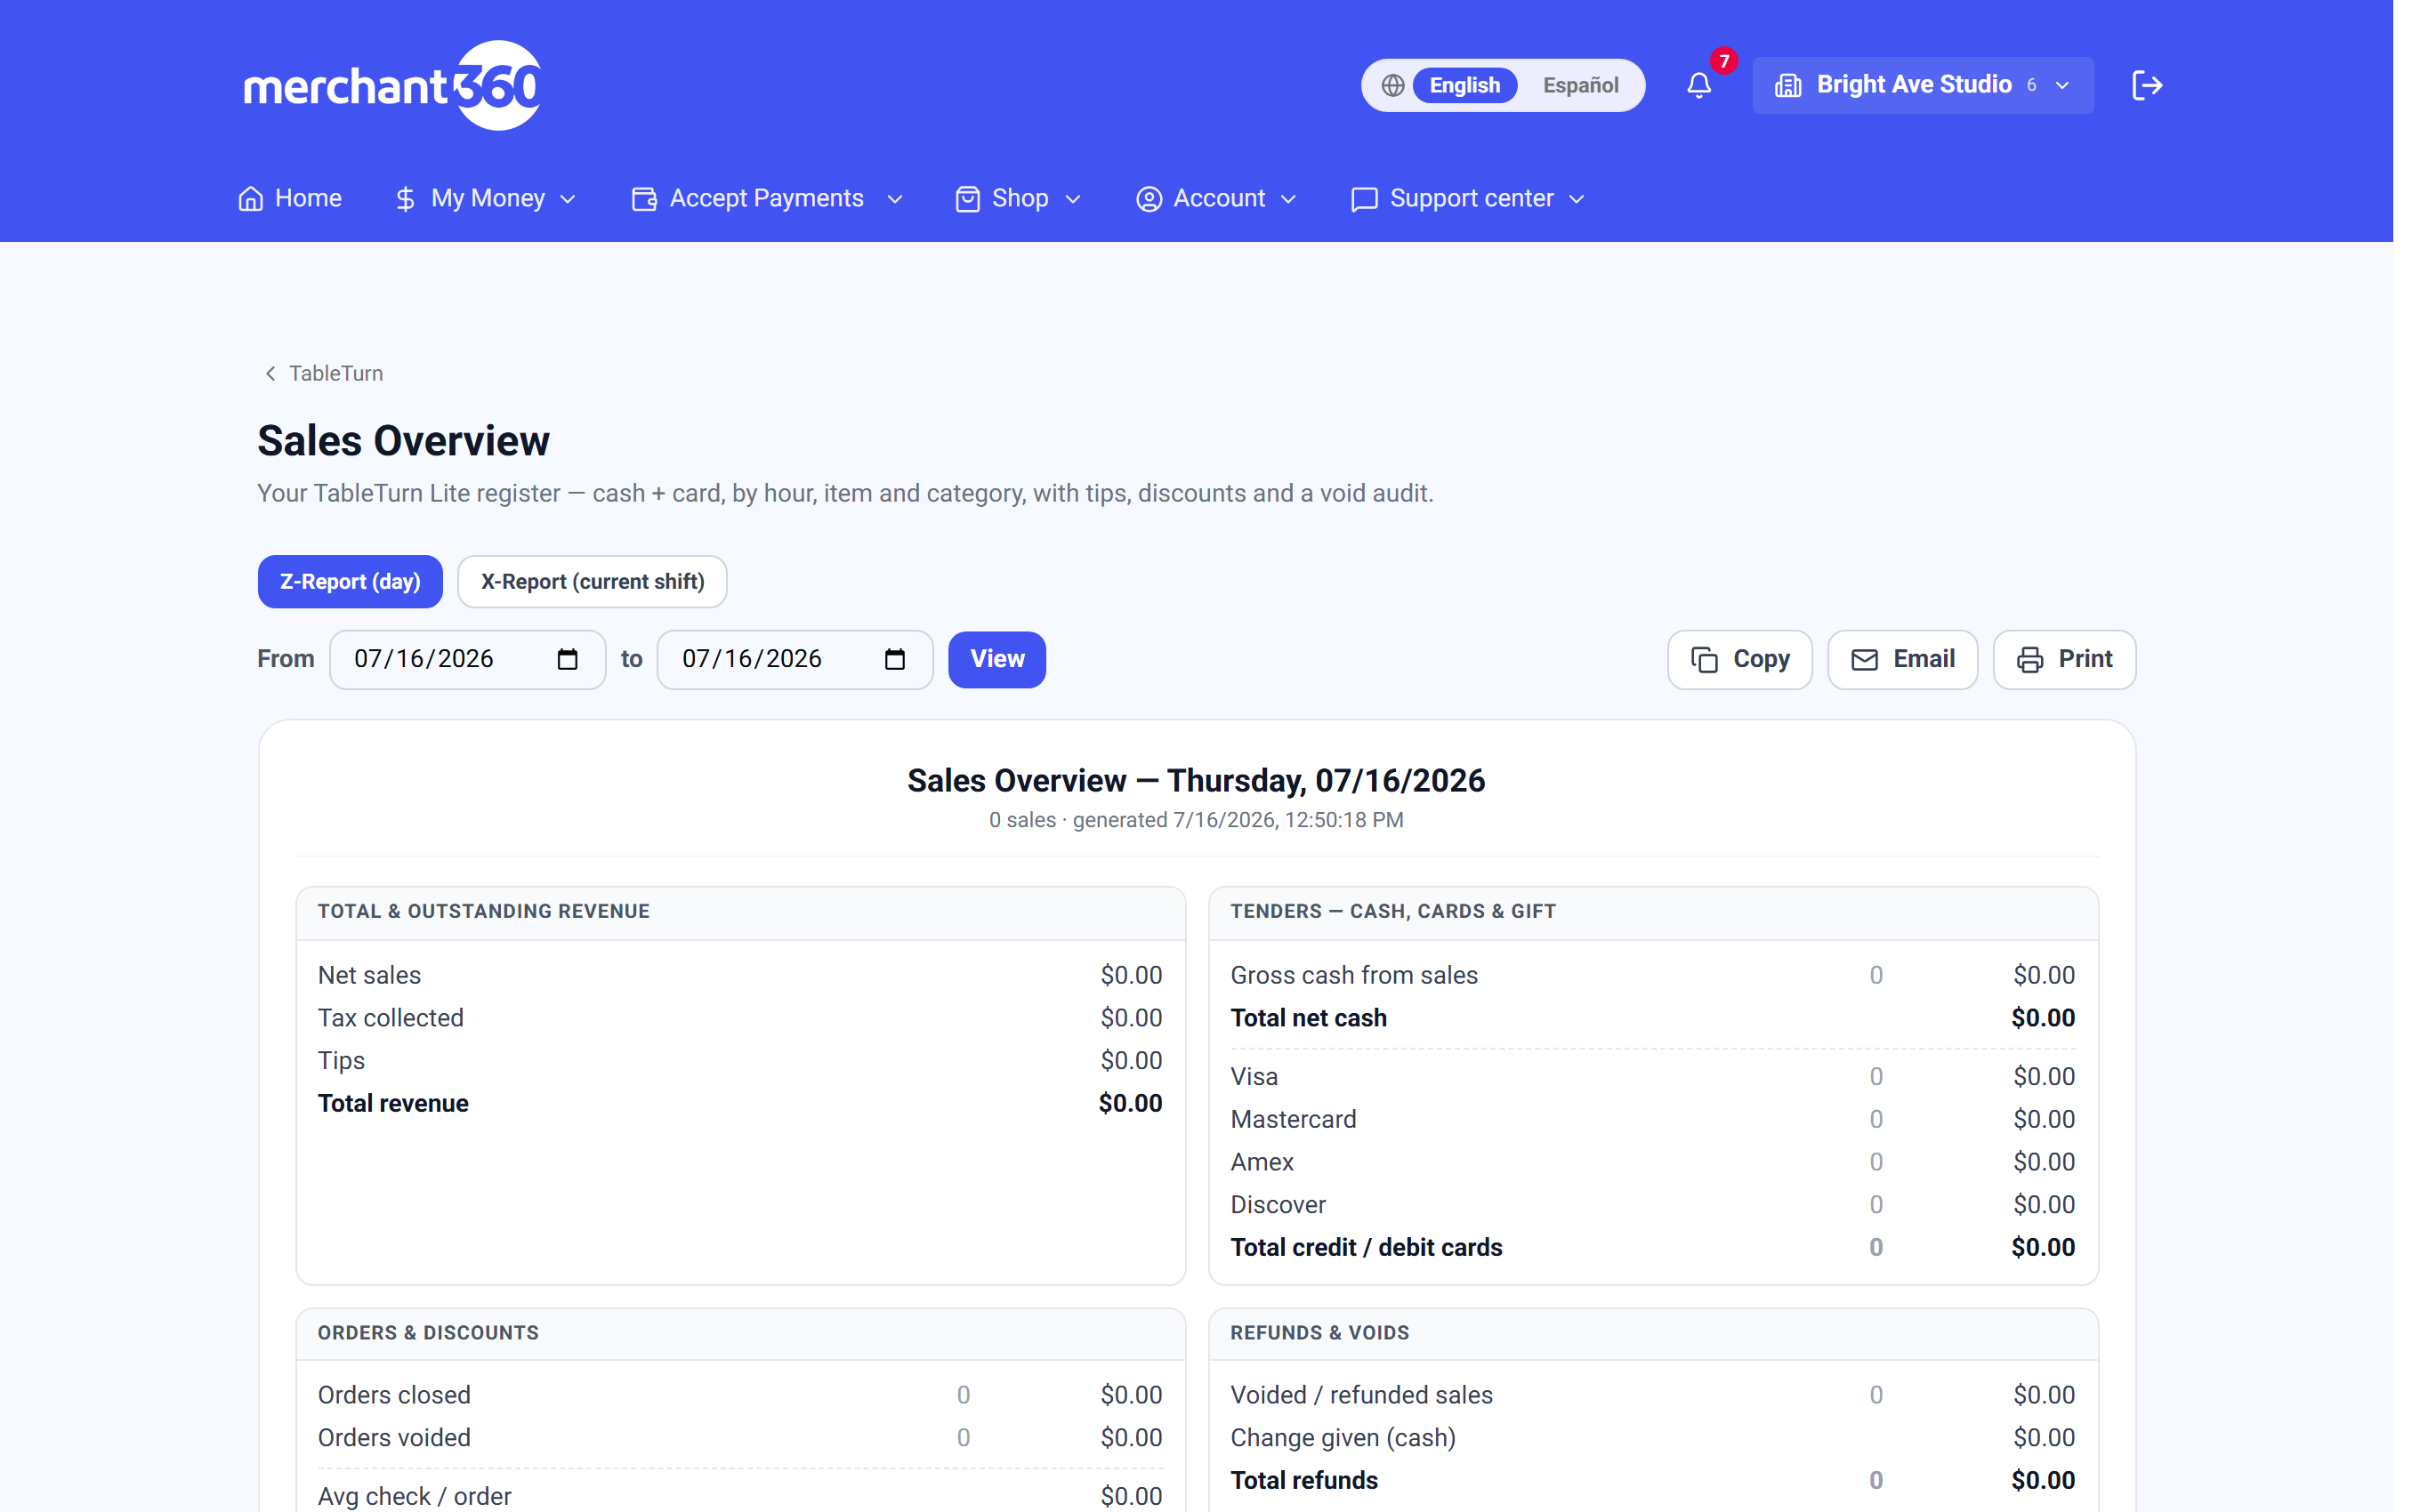
**Copy**, **Email** and **Print** are on the toolbar. Email sends a plain-text summary of everything below – the fastest way to get the night's numbers to a bookkeeper without exporting anything.
The money, at the top
Total & outstanding revenue – net sales, tax collected, tips, and total revenue.
Tenders breaks the money down by how it arrived: cash, then each card brand separately – Visa, Mastercard, Amex, Discover – and gift cards, each with a count beside the amount. Counts matter as much as totals; twenty small card sales and two large ones are different days.
Orders & discounts carries orders closed, orders voided, and what you gave away. Refunds & voids shows reversals and change given.
You also get average check per order and, when you track guests, average check per guest – which is the number that actually tells you whether upselling is working.
Reading the shape of the day
Sales by hour shows when the money came in, and calls out your busiest hour explicitly. It's the report that decides staffing.
Order type splits dine-in, takeaway and delivery. Sales by category shows the mix – food against drink is usually the split worth watching.
Gross sales by item ranks what sold. Margin by item ranks what actually made money, which is rarely the same list.
Customer ratings averages what guests left on the customer display, out of five.
Labour and tips
Hours by cashier turns punches into hours, decimal hours, and – where you've set an hourly wage – a labour cost. It totals into labour cost as a percentage of net sales, which is the single most useful line on the whole report.
Tip-out by cashier shows what each person is owed: card tips plus auto-gratuity, with a per-hour figure beside it. That per-hour number is what makes a tip-pool conversation short.
Table Time (rentals) appears when you rent by the hour, with sessions, minutes and revenue per rate.
Wages are set per cashier on the Cashiers page. Without them you still get hours; you just don't get the labour percentage, which is the part worth having.
The accountability section
Voids & discounts by cashier is the report to know about. Per person it shows voids, discounts, comps, and an exposure figure with a percentage – the total value that passed through their hands without being collected.
Void & discount audit lists the individual events behind those numbers, with their reasons.
This is not about assuming bad faith. Most of what shows up is training: someone voiding rather than correcting, or comping instead of discounting. But it is the only place that difference is visible.
This is why discount and void **reasons** are worth setting up. Without them the audit shows amounts with no explanation, and an unexplained number is either alarming or ignored – neither is useful.
Reconciling the drawer
The cash drawer card puts expected cash against what was counted, so the Z-report and the physical till are settled in one place rather than two.
If a drawer is still open when you run the report it says so – still open, close it to reconcile. That's a prompt, not an error: the count hasn't happened yet, so there's nothing to compare against.
Rounding gets its own line when cash rounding is on, as a net gain or loss, so pennies don't quietly become a discrepancy.
All orders – the day's receipts
All orders in the register's top bar is the transaction-level view the report summarises: open tabs, sales waiting on a tip, and everything closed.
Per sale you can Ring again (rebuild it as a new ticket), reprint the receipt or the kitchen ticket, or email it. Nothing ever just vanishes – if a number on the report looks wrong, this is where you find the sale behind it.
Insights – the deeper reporting
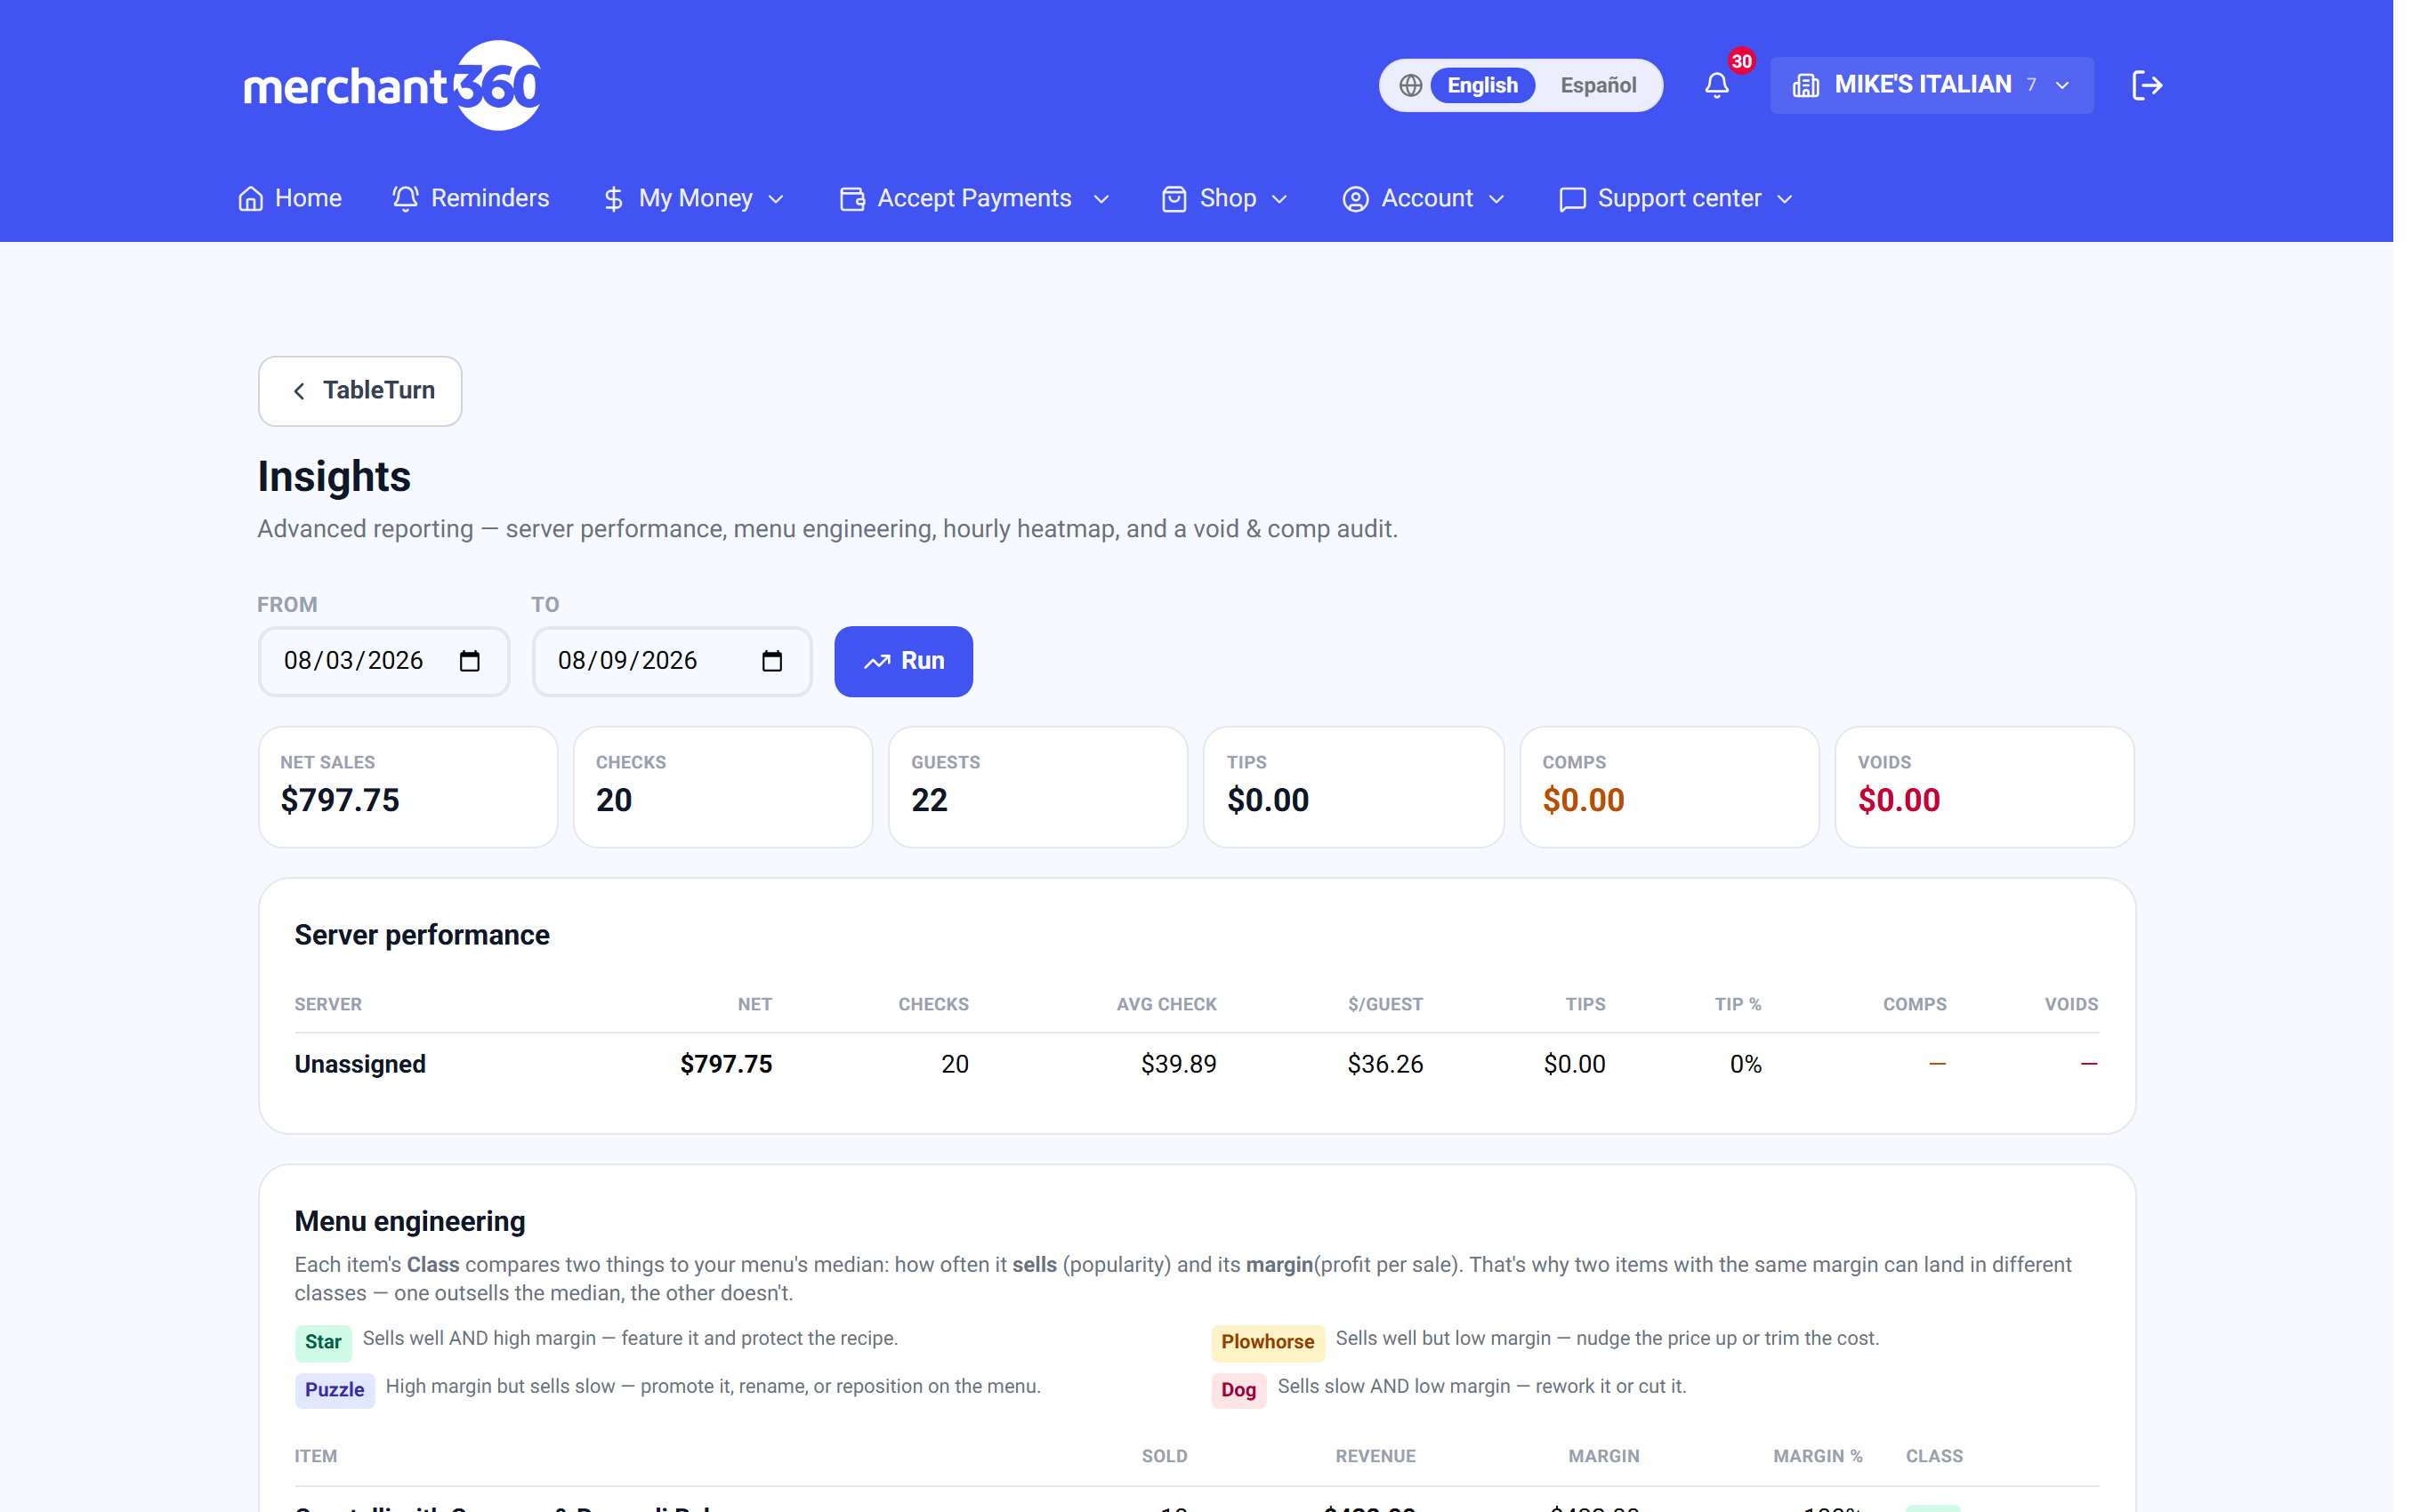
Insights is the advanced reporting workspace, and it's a Pro feature. Pick a date range, hit Run, and it gives you headline KPIs – net sales, checks, guests, tips, comps and voids – then server performance, an hourly heatmap, a void and comp audit, and menu engineering.
Food cost & recipes
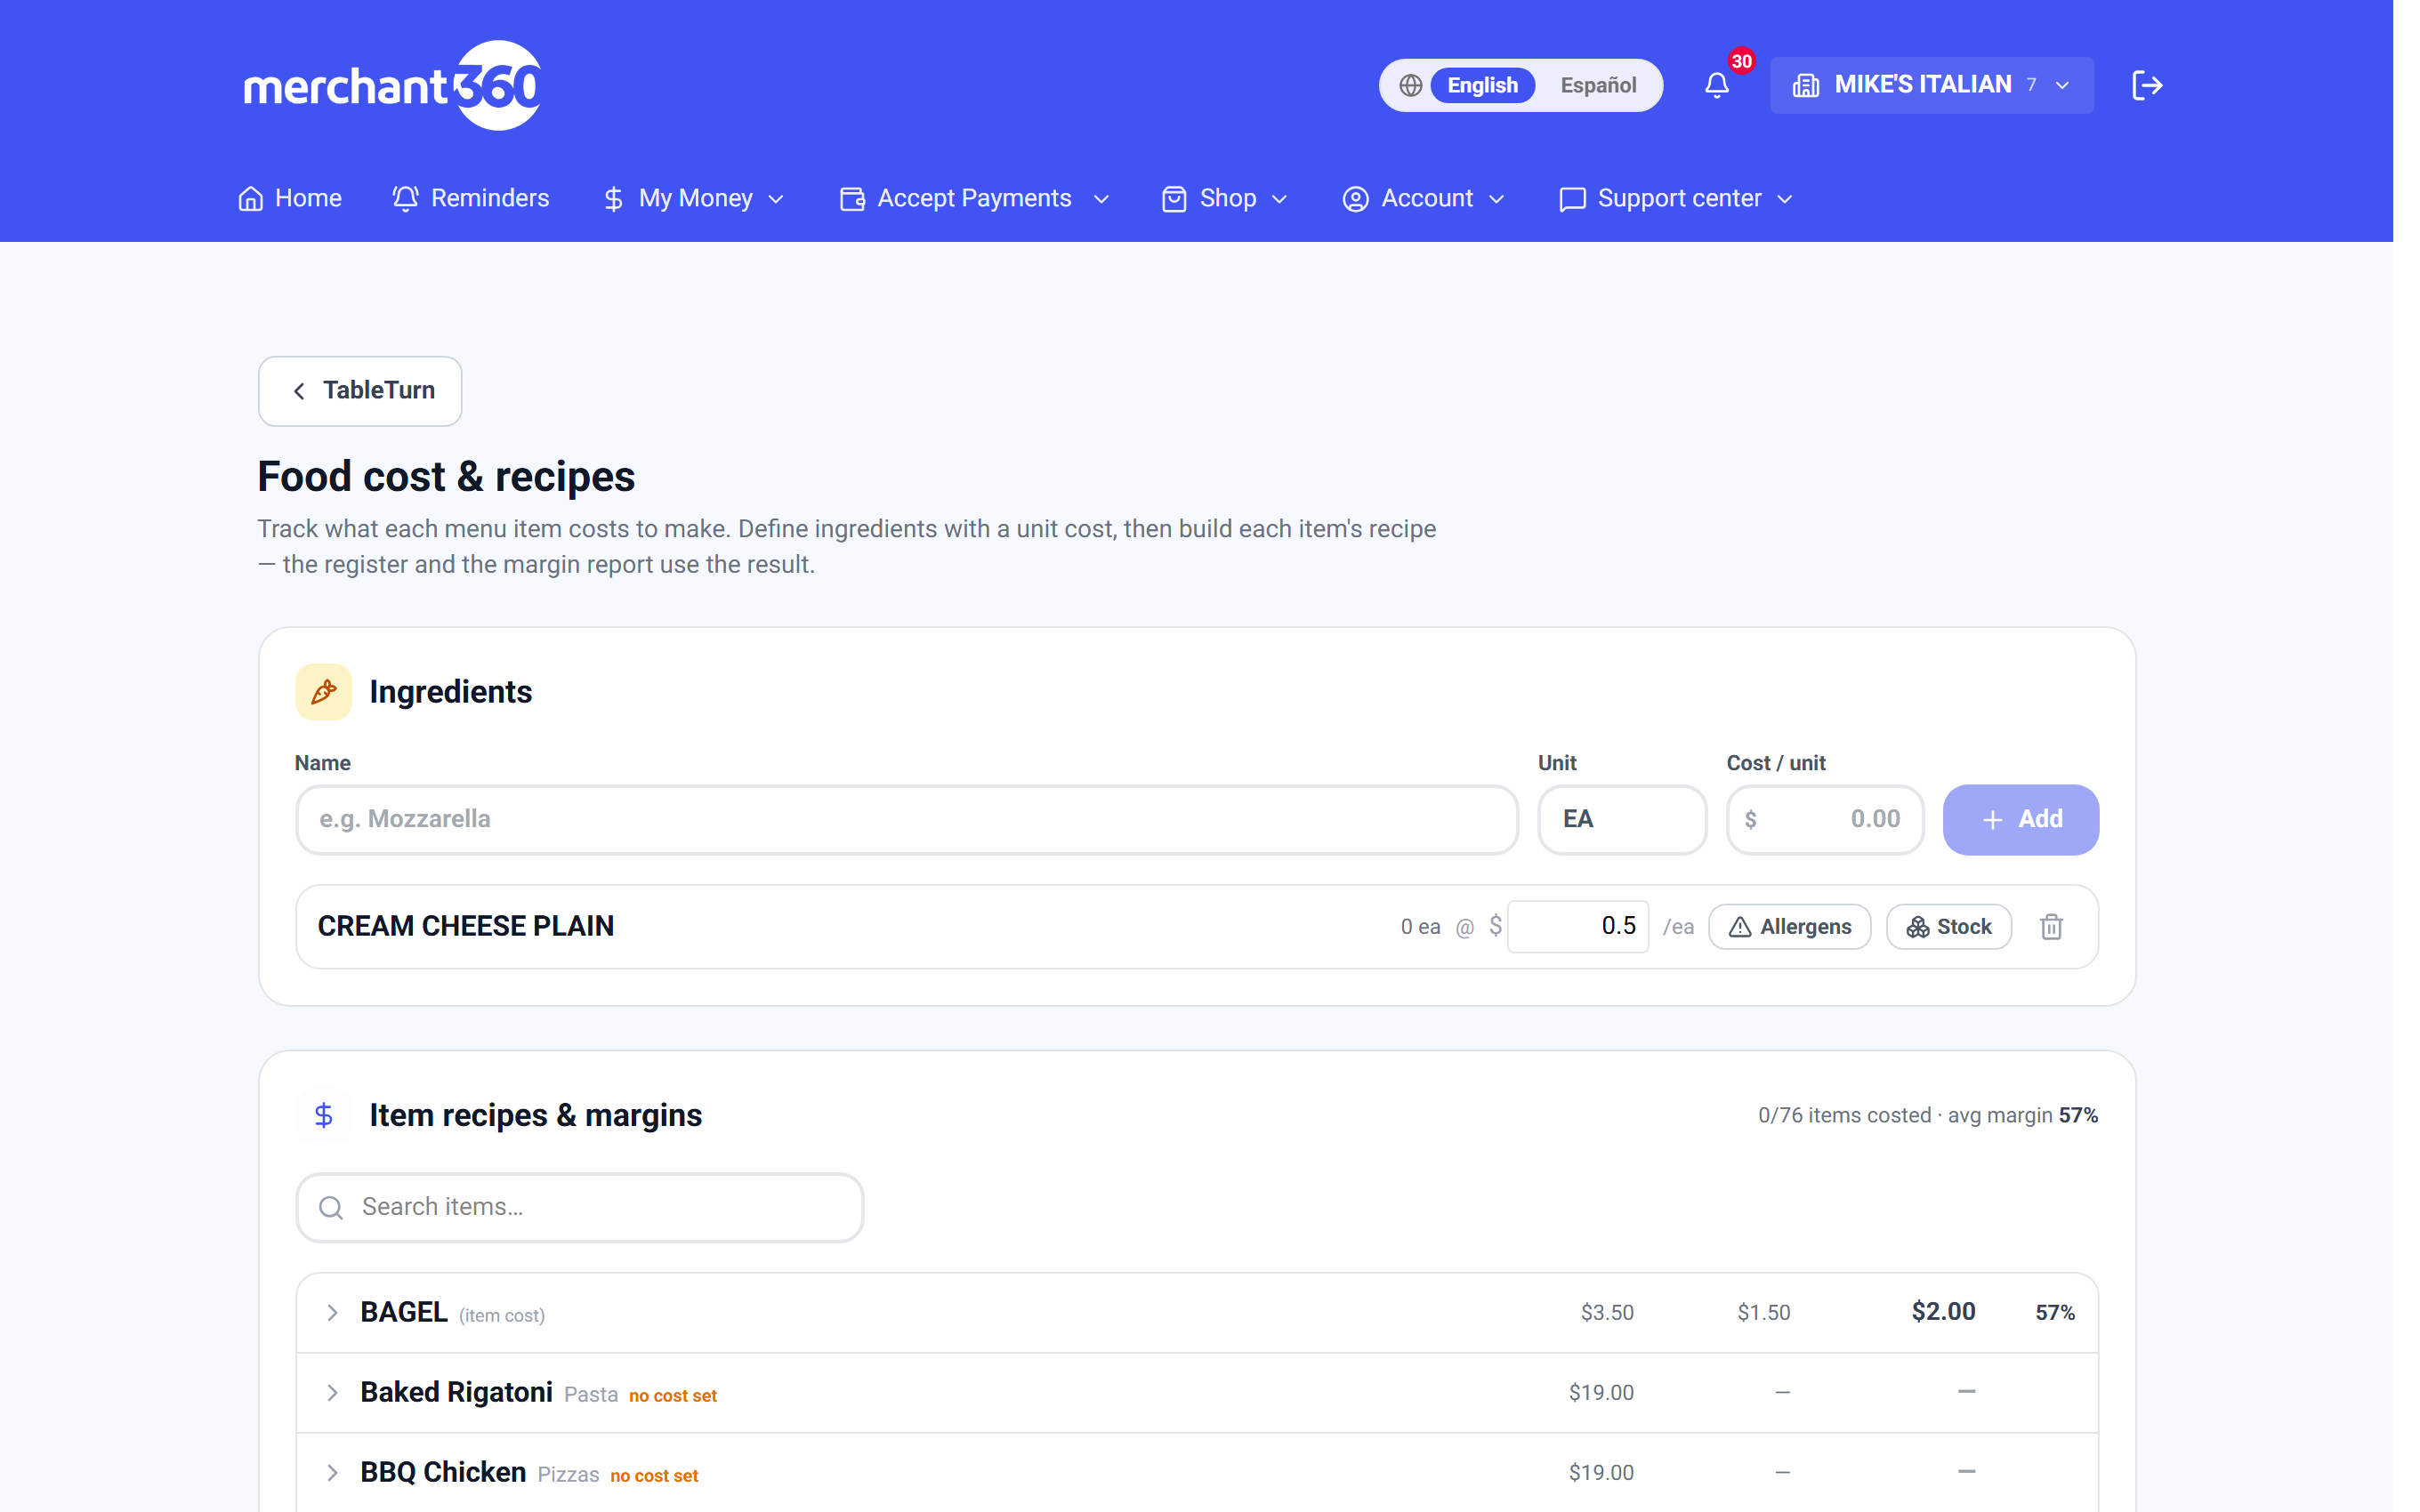
Food cost & recipes is where the margin numbers come from, and it's a Lite+ feature. It has two halves.
An ingredient master – each ingredient with its unit and cost per unit, and optionally its allergens and stock. And per-item recipes – expand a menu item, add ingredients with quantities, and watch its cost and margin update live as you build it.
The header keeps you honest: 0 / 76 items costed, with an average margin beside it. Uncosted items are marked no cost set rather than quietly assumed, which is the same discipline the margin report applies.
Costing every item is a real afternoon's work. Costing your twenty best sellers is an hour and gets you most of the value, because those are the items where a few cents matters.
Profit & loss
Owners get a P&L view in the back office, above and beyond the register reporting. It's owner-only – managers with full register rights don't see it.
Which report answers which question
"How are we doing right now?" – X-report.
"What happened last night?" – Z-report for that day.
"Why was last month worse?" – Z-report over a date range, then sales by hour and by category.
"Are we overstaffed?" – hours by cashier and labour cost %, against sales by hour.
"Which dishes should change?" – menu engineering, then food cost.
"What happened to this one sale?" – All orders.
"Why is the drawer short?" – the cash drawer card, then voids & discounts by cashier.